Plausible Data Studio connector
Plausible keeps its dashboard intentionally simple. For cases where you need more flexibility, such as custom client reports, branded dashboards or views that combine Plausible data with ad spend or CRM data, we have an official connector for Google Data Studio.
Google Data Studio, formerly called Looker Studio, is Google's free data visualization tool. The Plausible connector lets you pull your analytics data directly into Data Studio and build a report around your needs.
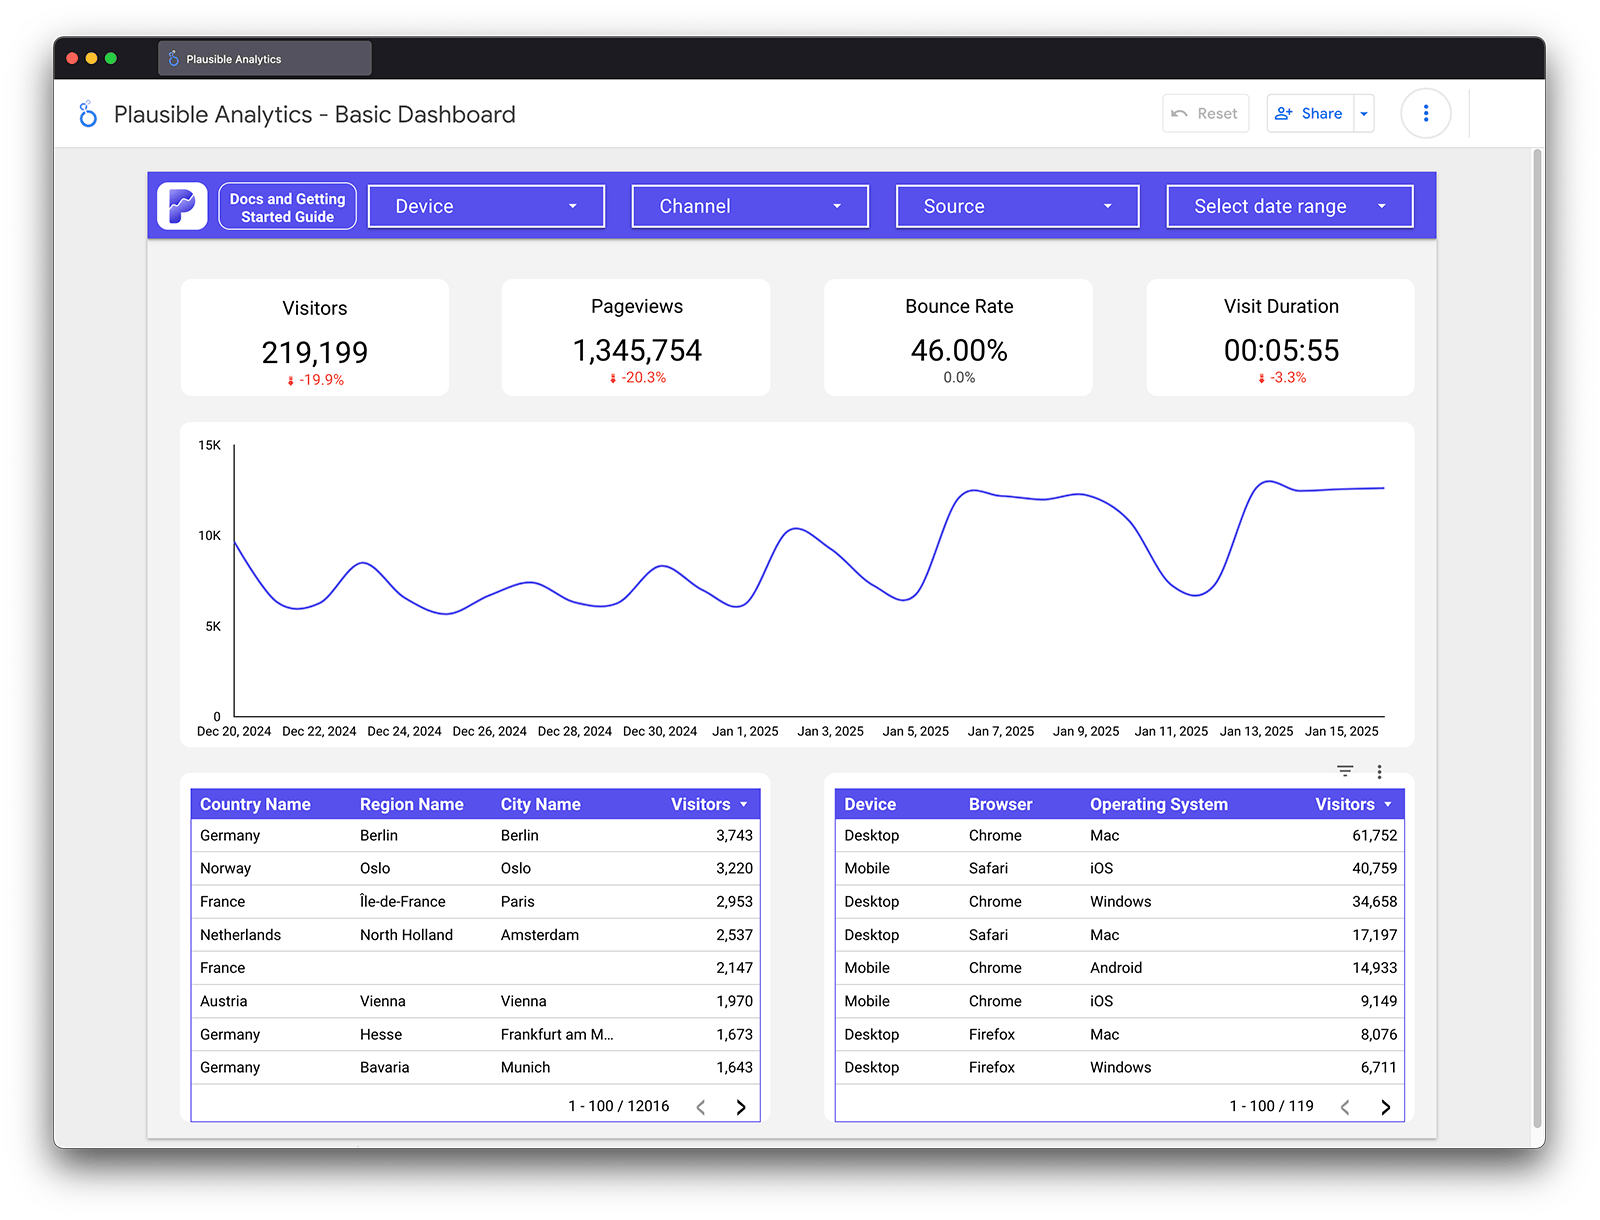
Connect to Data Studio
Add the Plausible Analytics connector as a new data source in Data Studio. It appears in the public and in-product connector galleries with Plausible Analytics listed as the developer. You can also open the connector directly.
Once you have selected the data source, you will be prompted to authorize the connector to access your Google account.
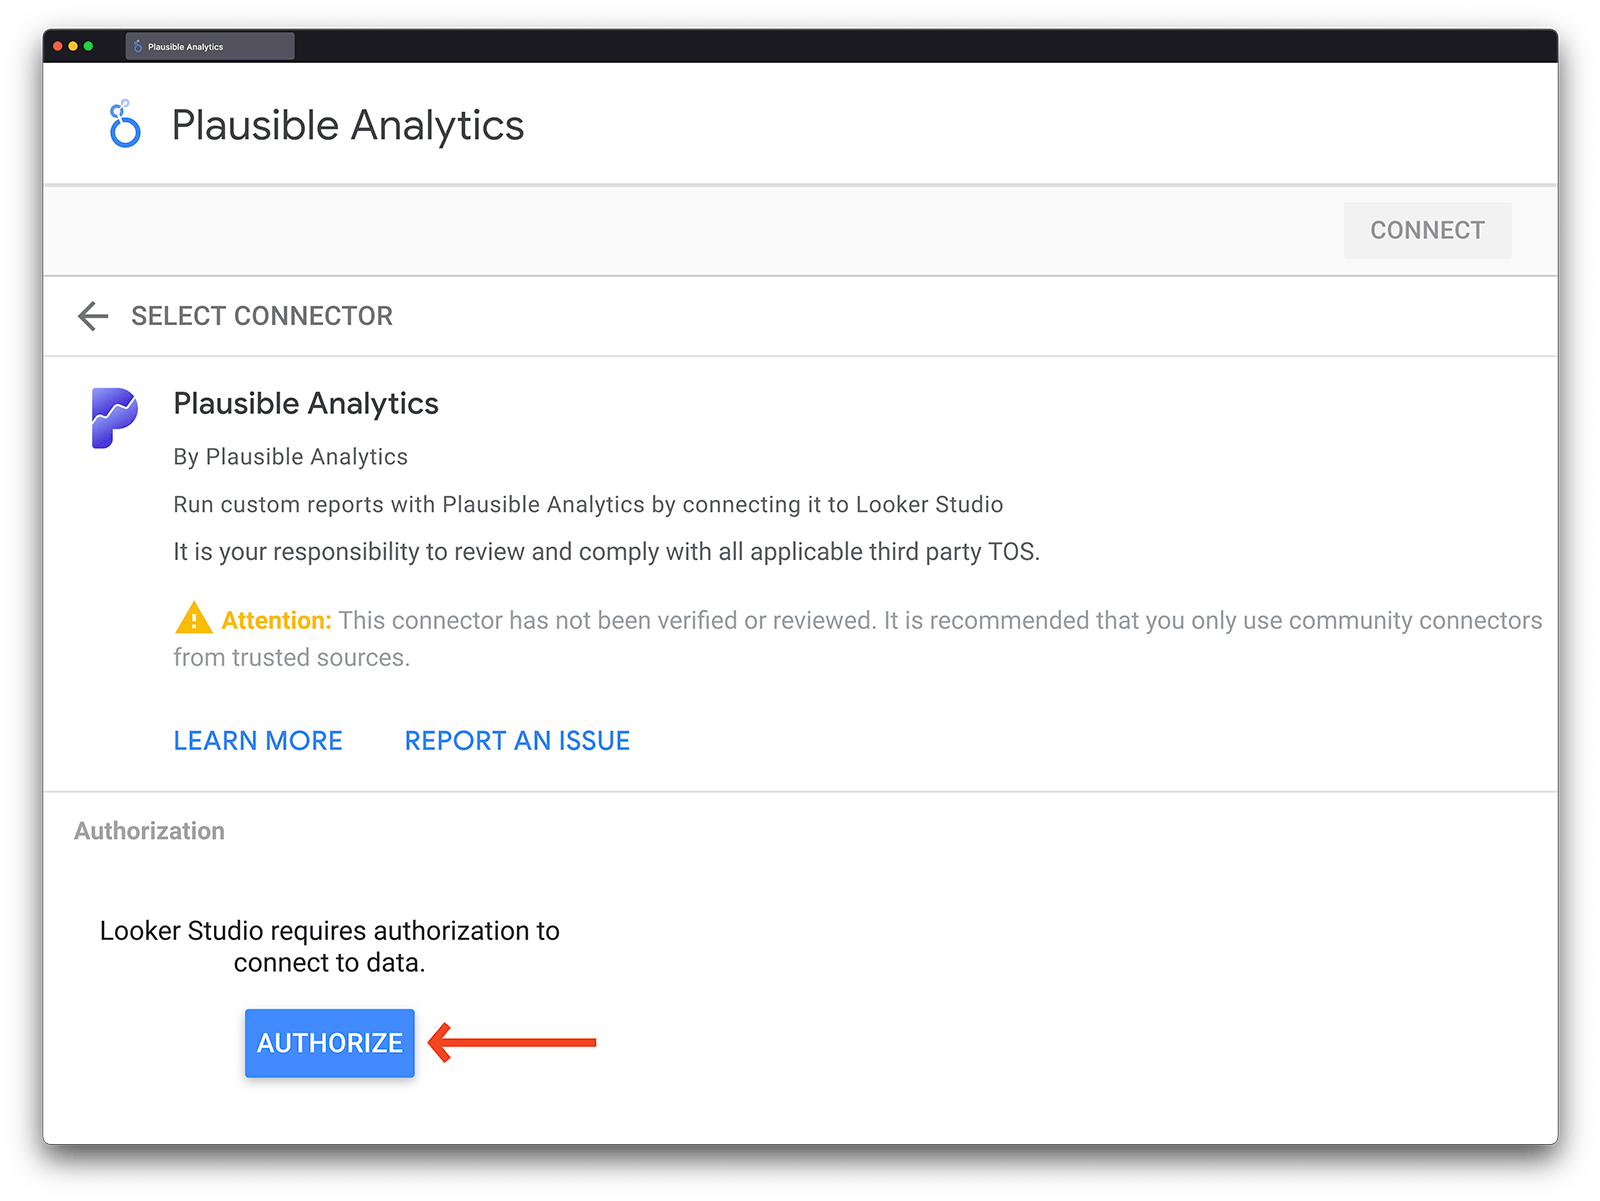
The only permission that will be asked for is to make an external API request, which is how the connector pulls data from the Plausible Analytics Stats API.
Insert your Plausible Stats API key
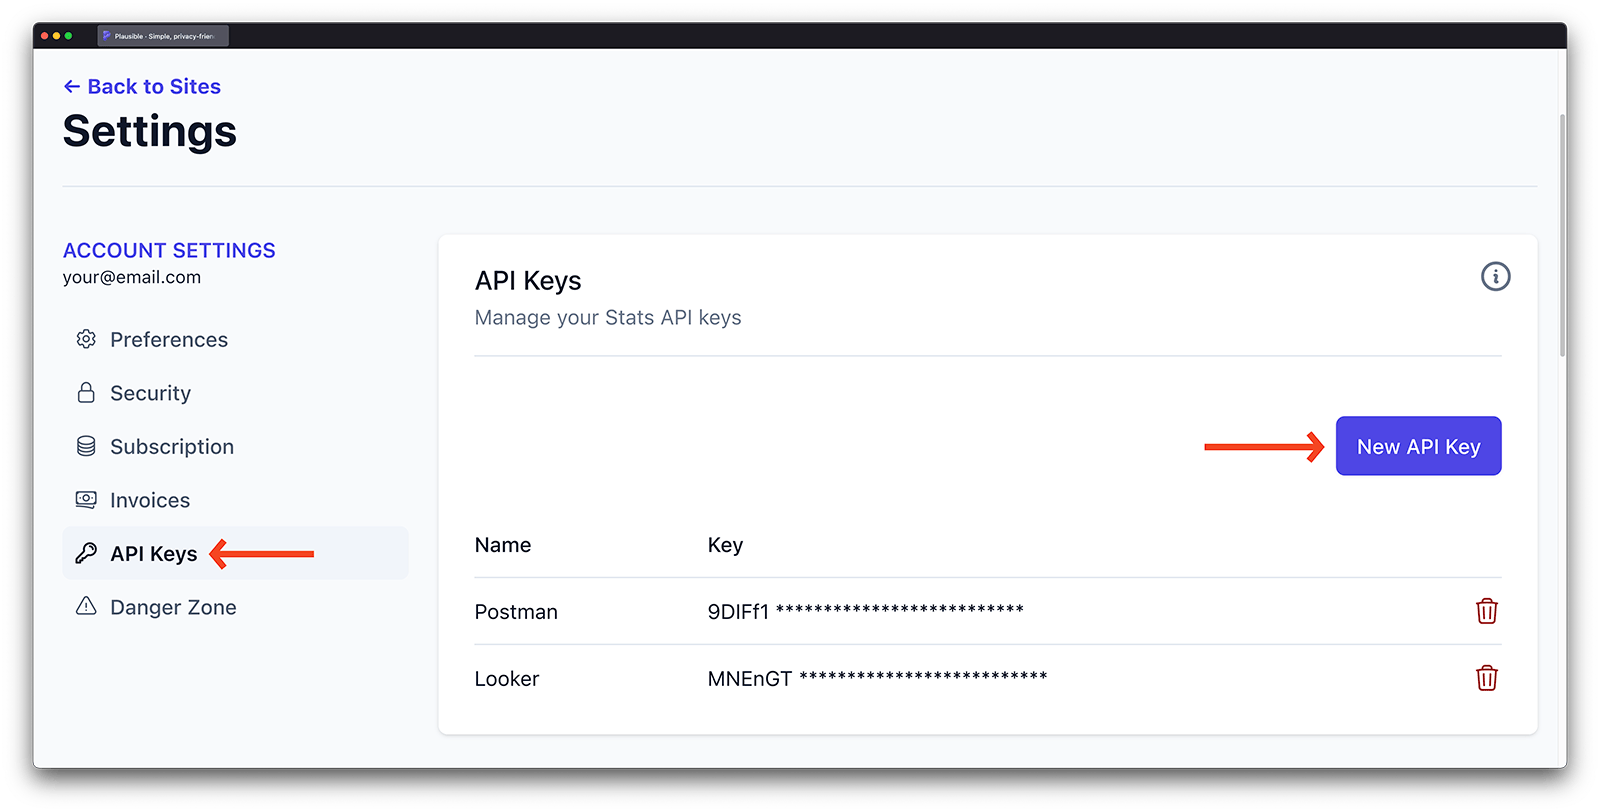
After authorizing your Google account, you will be prompted to enter your Plausible Analytics Stats API key. You can create a new API key for our Stats API by going to your Plausible Analytics account, navigating to Account Settings and clicking on the section called API Keys.
Click the New API Key button and be sure to save the result as you will only see the key once. However, you can always delete the key and create a new one if you no longer remember what it is.
Simply paste your API key into Data Studio when prompted. After that, you'll see a dropdown menu showing all the sites linked to your Plausible account.
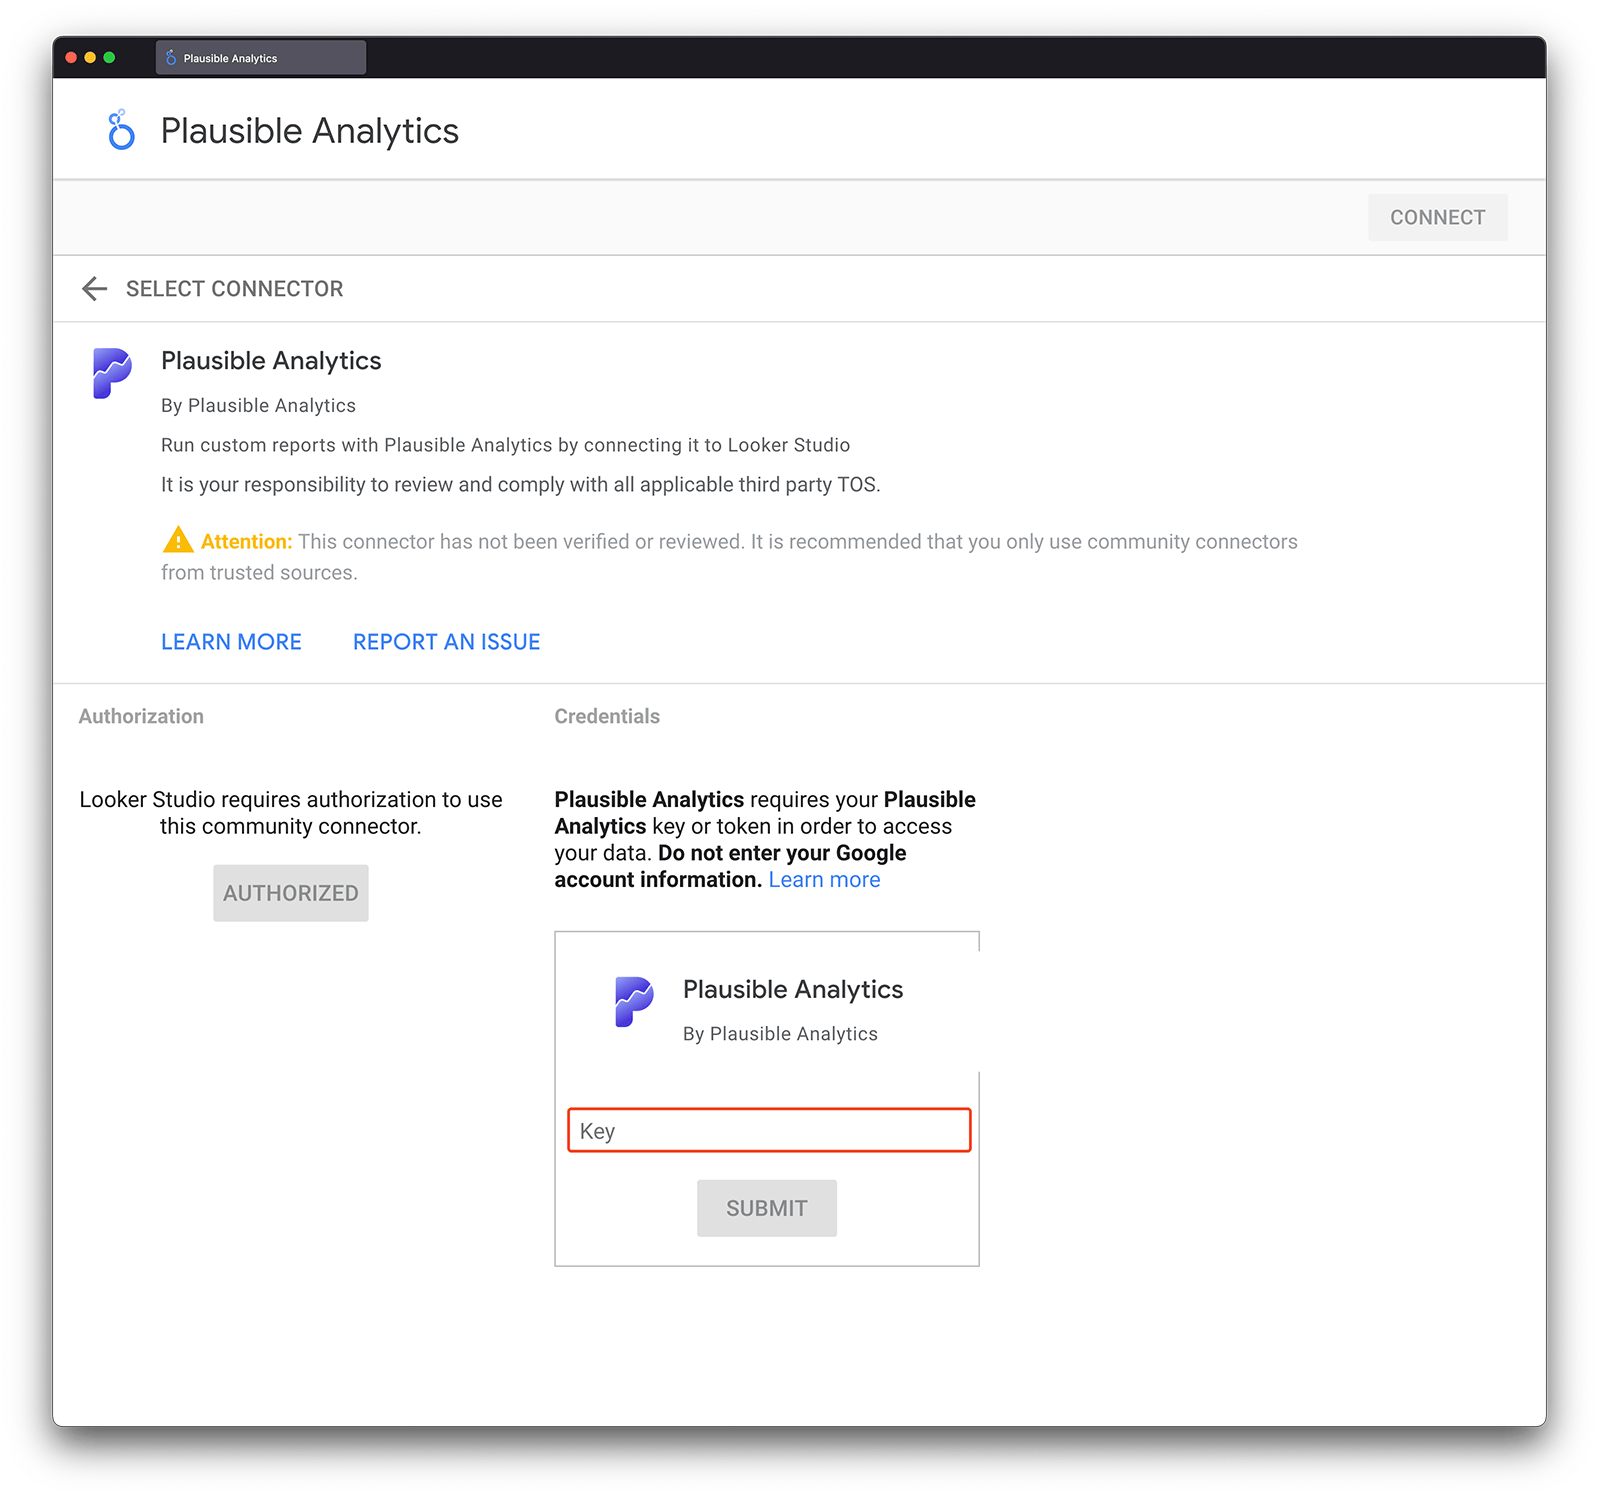
This means you have successfully linked your Plausible Analytics account to Data Studio.
Configure the Plausible Data Studio connector
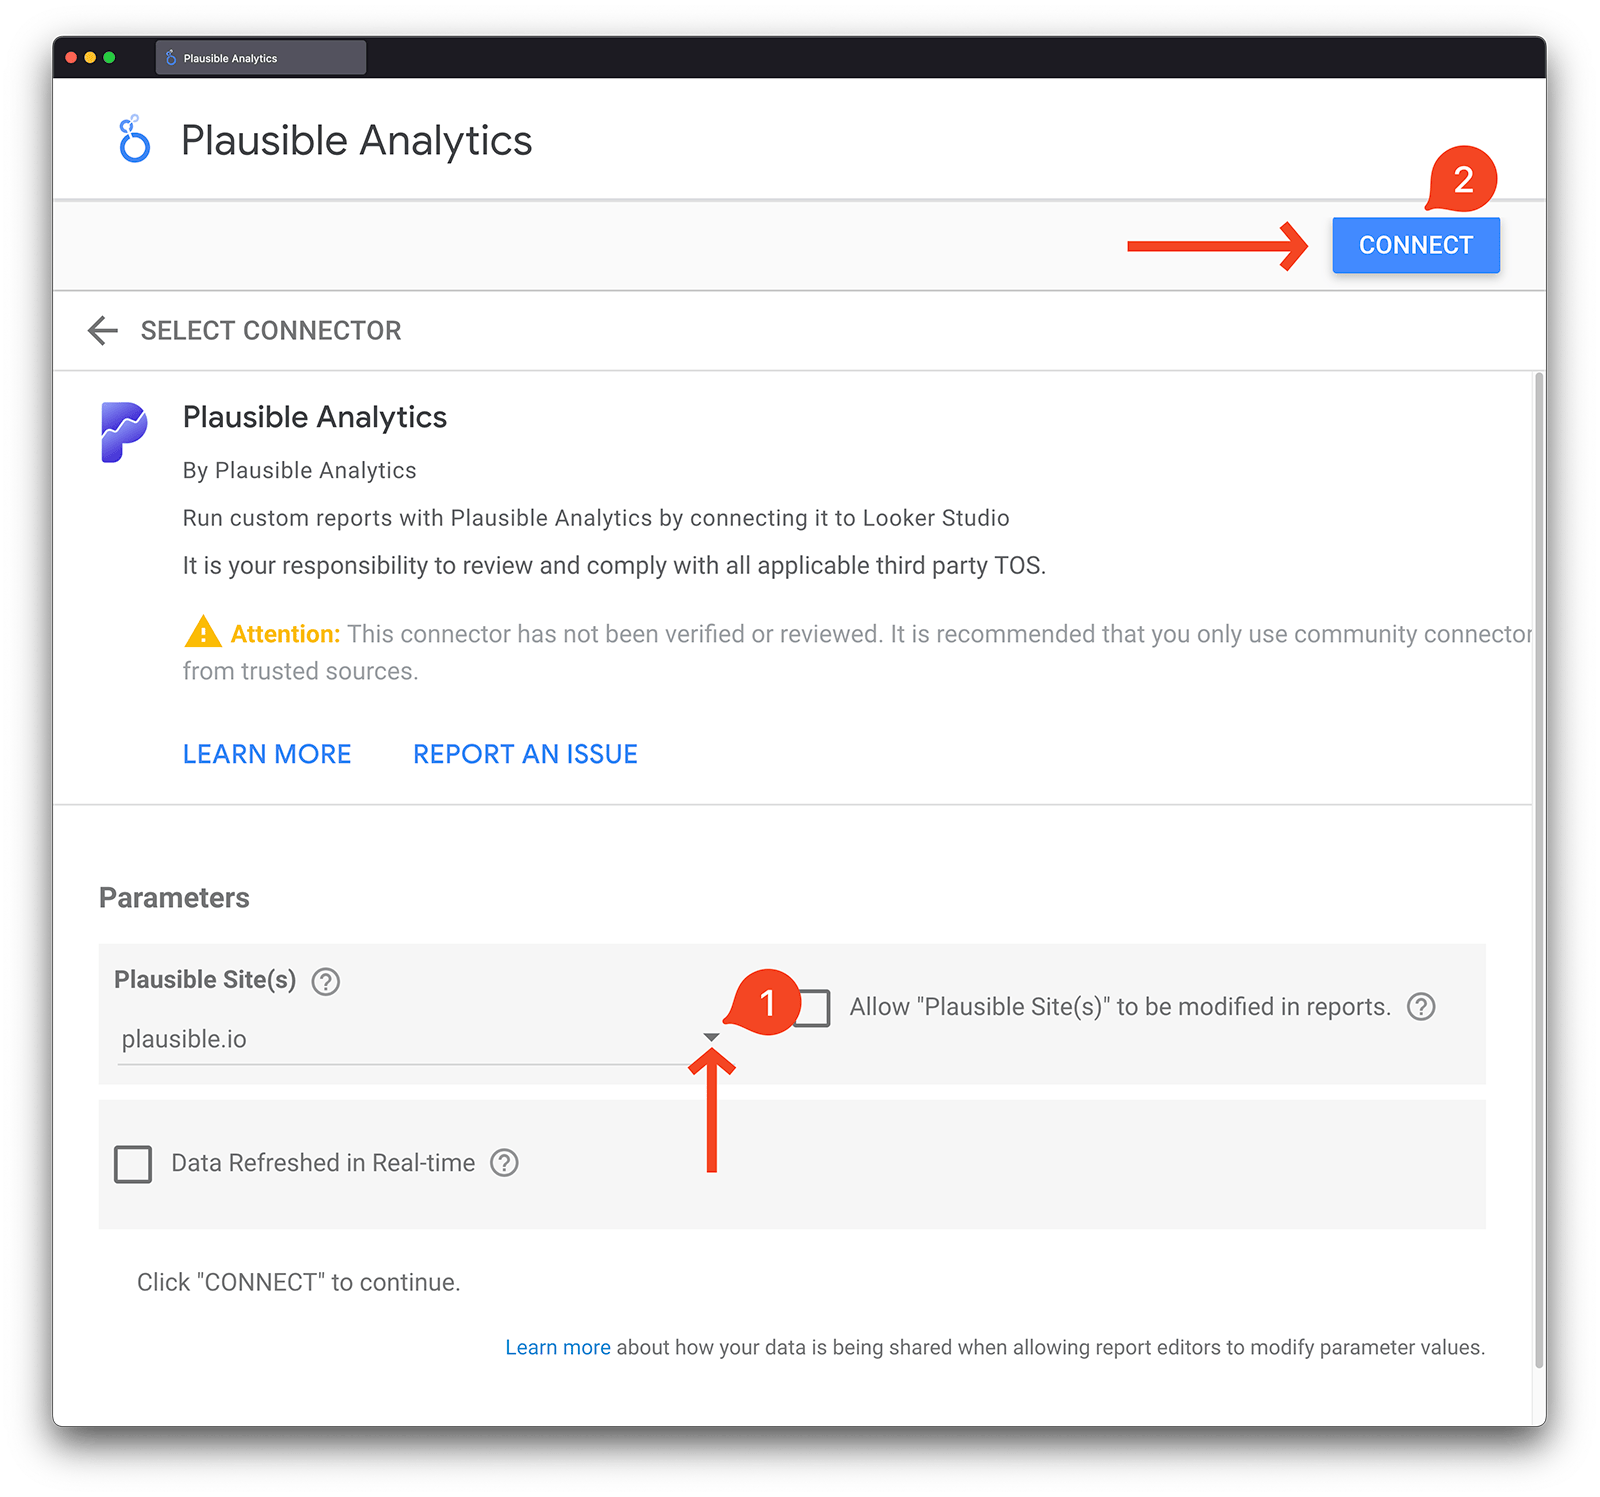
You can select one or more of your Plausible sites to create a custom report. Simply tick the box next to each site that you want to include data for.
At this stage, you can check Allow "Plausible Site(s)" to be modified in reports. This default option in Data Studio lets you add a dropdown in your report to switch between your Plausible sites. If you don’t check it, you won’t have this feature.
Check the Data Refreshed in Real-time box to bypass the connector's six-hour cache and fetch current data for report queries.
If this box is not checked, the connector caches data for six hours. This makes reports quicker and limits the number of API requests. Stats API keys are limited to 600 requests per hour by default. If you need more capacity, please contact us.
Once these options are configured, you can click Connect and you will see a list of all available fields for data and metrics that you can pull from Plausible.
Create your custom reports
Finally, you can either click on Create Report or Explore to begin using your Plausible data in Data Studio. Explore is best for ad-hoc data exploration while reports are best for creating set reports that you can share with others.
That's it! You're ready to start creating your custom reports using the Plausible Analytics data.
You can explore this simple report and this advanced report that we’ve created in Data Studio which you can use as a template to start building your own custom reports.
If you need some help on how to use Data Studio, take a look at our Data Studio beginner's guide.
Working with goals and custom properties
Your goal data comes through the Goal Name dimension. Use the Events metric for total conversions, the Visitors metric for unique conversions and the Conversion Rate metric for the conversion rate. Conversion Rate requires Goal Name to be added as a dimension or used in a filter. You can add a custom property field alongside it to filter or break down those conversions.
Your custom properties come through two fields: Custom Prop (the property name, for example url) and Custom Prop Value (the values recorded for it).
To make a custom property visible in the Plausible dashboard, add it for your site under Site Settings > Custom Properties. See how to configure custom properties.
For example, to build a table that lists each downloaded file with its number of downloads (using file downloads tracking, which records the file URL in the url property):
- Dimension: Custom Prop Value
- Metric: Events (add Visitors too if you want unique downloaders)
- Filter: Custom Prop equals url
- Filter: Goal Name equals File Download
Troubleshooting
A report shows null values or an error. Check your combination of dimensions and metrics. Session metrics such as Bounce Rate, Views per Visit and Visit Duration cannot be combined with event dimensions such as Goal Name or Custom Prop. If a combination returns null values or an error, use the Visitors metric instead or move the dimension into a filter. Our Data Studio guide covers these combinations with examples.
A newly configured custom property or goal doesn't show up. Unless you've checked the Data Refreshed in Real-time box, the connector caches data for up to 6 hours, so new values can take that long to appear in your report. If you need them immediately, edit the connection and enable real-time refresh. Refreshing fields only updates the data source schema, not the values in your report.